 by
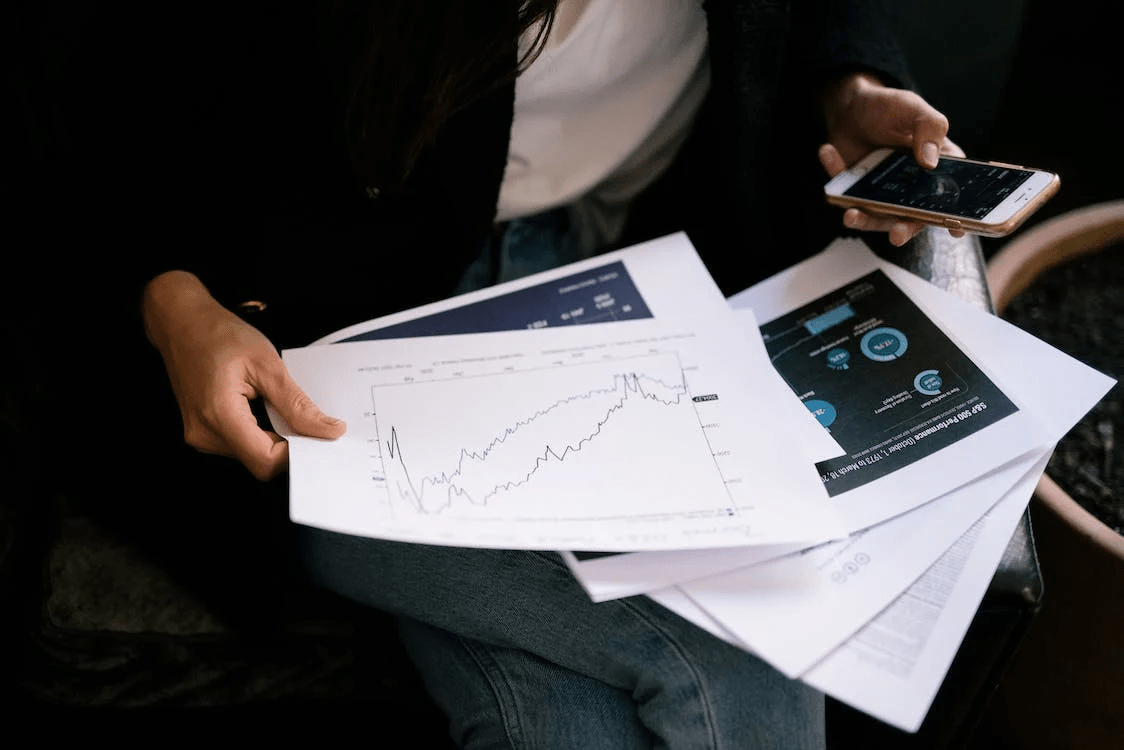
by When you’re looking to invest in the Forex market, you must have the right tools at your disposal. One of the most important tools is a good set of charts. In this article, we’ll discuss what Forex charts are, why they’re important, and how to use them effectively. We’ll also provide a few tips on how to find the best free Forex charts online. So whether you’re just getting started in the world of Forex trading or you’re looking for an upgrade on your current charting software, read on for everything you need to know about free Forex charts!
Why use a Forex Chart?
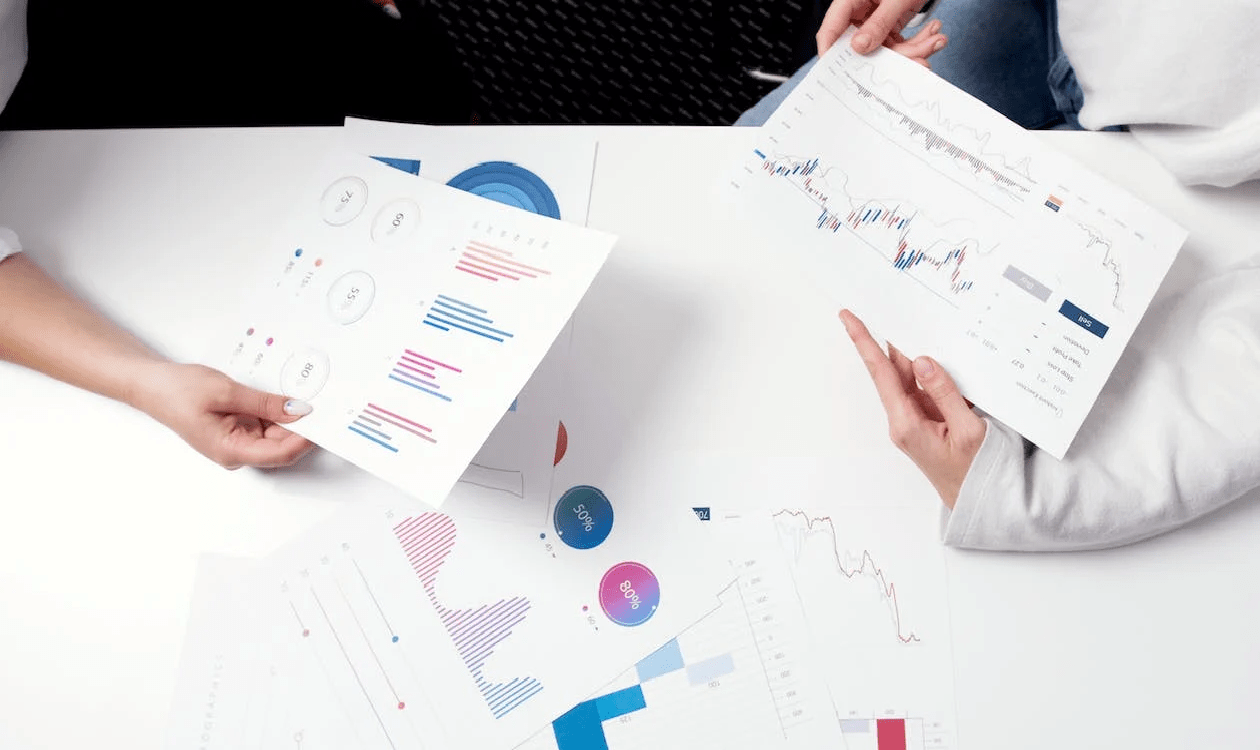
A Forex chart is simply a graphical representation of the currency pair you’re interested in. It shows you the current exchange rate, as well as the highs and lows for a given period. You can use Forex charts to track your progress over time, see how different events have affected the market, and make better trading decisions.
There are two main types of Forex charts: candlestick charts and line charts. Candlestick charts provide more detailed information than line charts, making them more useful for experienced traders. However, they can also be more difficult to read. Line charts are a good choice for beginners or if you’re only interested in tracking the overall trend of a currency pair.
How to Use Forex Charts
Now that you know a little bit about Forex charts, let’s discuss how to use them. The first step is to find good charting software. There are many different options available, so it’s important to do your research and choose the one that best suits your needs. Once you’ve found charting software that you’re comfortable with, it’s time to start looking at currency pairs.
When you’re just getting started, it’s a good idea to focus on major currency pairs. These are the most traded currencies in the world and they tend to be more stable than smaller pairs. As you become more experienced, you can start branching out and exploring other options.
Once you’ve selected a currency pair, you’ll need to choose a time frame. Time frames can be anything from one minute to one month. The time frame you choose will depend on your trading goals and how much time you’re willing to spend looking at charts.
Once you’ve selected a time frame, you can start looking at the different elements of the chart. The first thing you’ll notice is the price action. This shows you the current exchange rate as well as the highs and lows for the given period. You can also see volume, which is an indicator of how many trades are being made in a given period.
You can also add indicators to your Forex chart. Indicators are mathematical formulas that help traders identify potential trading opportunities. There are many different indicators available, so it’s important to do some research and choose the ones that best suit your trading style.